Introduction
If you are familiar with performance counter in windows you probably know that there are hundreds of performance counters divided into logical categories, all serving the purpose of monitoring the operation system, application or service in Windows.
Windows operation system provides a great handy application (which I am sure you must have used or heard of) named?perfmon.exe?(Start->Run->perfmon).?
You can still use perfmon in you Windows Azure environment to monitor a role instance?(by remote desktop a.k.a RDP to the role instance. Additional information is available?here and here).
Yet, monitoring an entire Azure application, composed of multiple role instances is extremely cumbersome, not to mention that the data is not saved locally (not by default).??
With that motivation in mind Microsoft created a mechanism Called?Windows Azure Diagnostics?that automates the gathering and persistence of diagnostic data from the role instances (in the essence the virtual machines) into an Azure Storage for a later and a deeper investigation.?Azure diagnostics retrieves many other types of diagnostics data like trace logs, crash dumps window event logs etc...?In this discussion will focus on performance counters which can share huge amount of critical information on how your Azure application functions. Practically, performance counters can help you isolate performance problem and most importantly save money by indicating if the Azure resources are optimally exploited.??
How Windows Azure Diagnostics Works?
Every role VM has a built-in diagnostics process (DiagnosticsAgent.exe) that is responsible for periodically collecting the diagnostic data, caching it to a local file and eventually storing to a predefined Azure Storage. Note that the diagnostics process can also be manually triggered.?
Specifically, the diagnostics data for the performance counters are persisted to a designated Azure table named?WADPerformanceCountersTable. Other diagnostics data such as trace logs, ?event logs etc.. are also stored in designated tables like:?WadLogsTable?,?WADDiagnosticInfrastructureLogsTable?etc.. (Additional information can be found?here).
Every role instance has a configuration file located in the azure storage under directory (blob directory) called?wad-control-container.?The configuration file primarily defines the performance counters to be collected and associated collection rate.???
The following?displays the location of the diagnostic?configuration?file. Access?wad-control-container using?Cloud Storage Manager for Azure:??
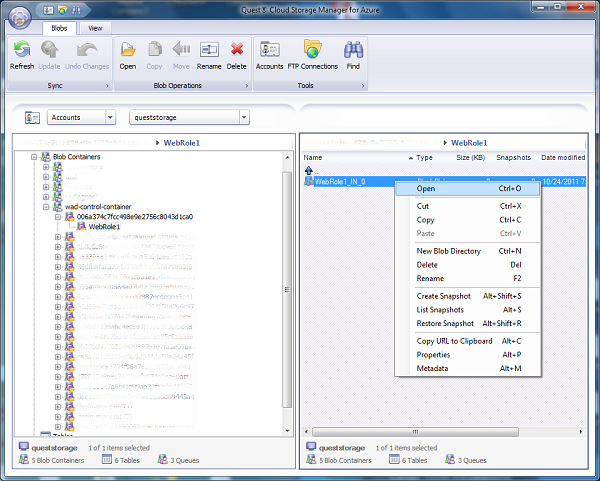
The configuration file uses a standard XML format and can be manually modified (although not recommended).??
Using the code??
In this article we will review:?
- How to configure performance counters from the Role code (running in the azure application) and remotely from an external program.?
- How to access the data from the azure storage table.
- Quick analyze of performance counters.?
The entire code is available for download below.?
First lets cover the API we going to use in order to enable monitoring for our role instances.?
Windows Azure Diagnostics API??
(definition taken from the MSDN)
To enable diagnostics monitoring in your role you must first import the diagnostic module in the ServiceDefinition.csdef configuration file. Visual Studio provides an easy way to enable the diagnostics via the role properties window in the cloud solution (more information is available here).
Configuring Performance Counters from within a Role Code?
The following code retrieves the role instance configuration (keep in mind that the diagnostics configuration is managed per role instance), sets a new performance counter to monitor and starts the diagnostics monitor with the modified configuration.
public class WebRole : RoleEntryPoint
{
public override bool OnStart()
{
var config = DiagnosticMonitor.GetDefaultInitialConfiguration();
config.PerformanceCounters.ScheduledTransferPeriod = TimeSpan.FromMinutes(5);
PerformanceCounterConfiguration cpuUtilizationCounter = new PerformanceCounterConfiguration()
{
CounterSpecifier = @"\Processor(_Total)\% Processor Time",
SampleRate = TimeSpan.FromSeconds(1)
};
if (!config.PerformanceCounters.DataSources.Contains(cpuUtilizationCounter,
new PerformanceCounterComparer()))
{
config.PerformanceCounters.DataSources.Add(cpuUtilizationCounter);
}
DiagnosticMonitor.Start("Microsoft.WindowsAzure.Plugins.Diagnostics.ConnectionString", config);
return base.OnStart();
}
private class PerformanceCounterComparer : IEqualityComparer<PerformanceCounterConfiguration>
{
public bool Equals(PerformanceCounterConfiguration a, PerformanceCounterConfiguration b)
{
if (Object.ReferenceEquals(a, b)) return true;
if (Object.ReferenceEquals(a, null) || Object.ReferenceEquals(b, null))
return false;
return (a.CounterSpecifier == b.CounterSpecifier && a.SampleRate == b.SampleRate);
}
public int GetHashCode(PerformanceCounterConfiguration counter)
{
if (Object.ReferenceEquals(counter, null)) return 0;
int hashCounterSpecifier = counter.CounterSpecifier ==
null ? 0 : counter.CounterSpecifier.GetHashCode();
return hashCounterSpecifier ^ counter.SampleRate.GetHashCode();
}
}
} Configuring Performance Counters Remotely
Configuring performance counters can also be performed externally to the role code, by using
Microsoft.WindowsAzure.Diagnostics.Management.
const string storageAccoutName = "Storage-Name-Here";
const string privateKey = "Storge-Private-Key-Here";
const string deploymentId = "Deployment-Id-Here";
var storageAccount = CloudStorageAccount.Parse(String.Format(
"DefaultEndpointsProtocol=https;AccountName={0};AccountKey={1}",
storageAccoutName, privateKey));
var diagnosticManager = storageAccount.CreateDeploymentDiagnosticManager(deploymentId);
RoleInstanceDiagnosticManager roleDiagManager =
diagnosticManager.GetRoleInstanceDiagnosticManager("WebRole1", "WebRole1_IN_0");
var currentConfiguariton = roleDiagManager.GetCurrentConfiguration();
currentConfiguariton.PerformanceCounters.ScheduledTransferPeriod = TimeSpan.FromMinutes(5);
currentConfiguariton.PerformanceCounters.DataSources.Add(new PerformanceCounterConfiguration()
{
CounterSpecifier = @"\Processor(_Total)\% Processor Time",
SampleRate = TimeSpan.FromSeconds(1)
});
roleDiagManager.SetCurrentConfiguration(currentConfiguariton); Retrieving the Performance Counter Data
Now that we've configured the counters we want to monitor, lets access the recorded data from the Azure Table (WADPerformanceCountersTable) and display it.??
I've created the PerformanceDataContext class that?derives?from?TableServiceContext
which is?part of the?ADO extensions that?Microsoft?provides in order to?connect?to Azure Tables. You can use a LINQ query in order to?retrieve?the data.
public class QueryExecuter
{
private CloudStorageAccount accountStorage;
public QueryExecuter()
{
accountStorage = CloudStorageAccount.DevelopmentStorageAccount;
}
public QueryExecuter(string accountName, string privateKey)
{
accountStorage = CloudStorageAccount.Parse(String.Format(
"DefaultEndpointsProtocol=https;AccountName={0};AccountKey={1}", account
}
public List<PerformanceData> QueryPerformanceCounter(string counterFullName,
string deploymentid, string roleName,
string roleInstanceName, DateTime startPeriod, DateTime endPeriod)
{
PerformanceDataContext context = new PerformanceDataContext(
accountStorage.TableEndpoint.ToString(), accountStorage.Credentials);
var data = context.PerfData;
CloudTableQuery<PerformanceData> query = null;
query = (from d in data
where d.PartitionKey.CompareTo("0" + startPeriod.Ticks) >= 0
&& d.PartitionKey.CompareTo("0" + endPeriod.Ticks) <= 0
&& d.CounterName == counterFullName
&& d.EventTickCount >= startPeriod.Ticks
&& d.EventTickCount <= endPeriod.Ticks
&& d.DeploymentId == deploymentid
&& d.Role == roleName
&& d.RoleInstance == roleInstanceName
select d).AsTableServiceQuery<PerformanceData>();
List<PerformanceData> selectedData = new List<PerformanceData>();
try
{
selectedData = query.Execute().ToList<PerformanceData>();
}
catch
{
}
return selectedData;
}
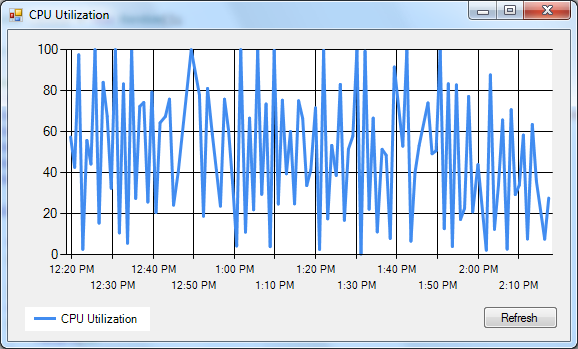
} For this demonstration I've created a Chart in WinForm that is populated with data?retrieved?from the diagnostic table.???
The graph created displays the CPU utilization of specific role instance for the last 2 hours.
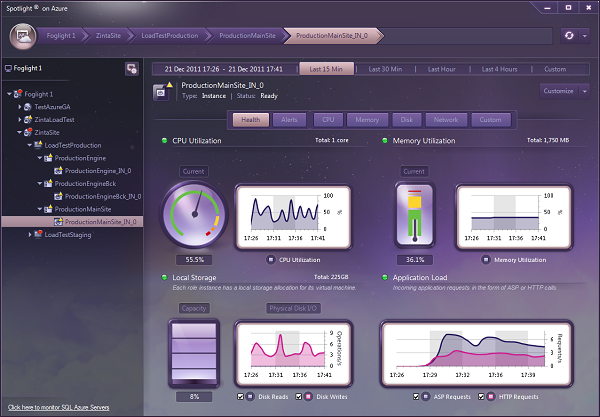
Points of Interest
Quest Software develops a very handy and easy to use tool called?Spotlight on Azure.?We provide an in depth monitoring capabilities of the entire Azure subscription starting from the role instance and above, data aggregation, historical display, alerting mechanism and custom user defined counters for deep analysis.??
Source: http://www.codeproject.com/KB/azure/azure-diagnostics.aspx
rachel crow steelers browns albert pujols pau gasol virginia tech va tech duggar miscarriage
No comments:
Post a Comment
Note: Only a member of this blog may post a comment.